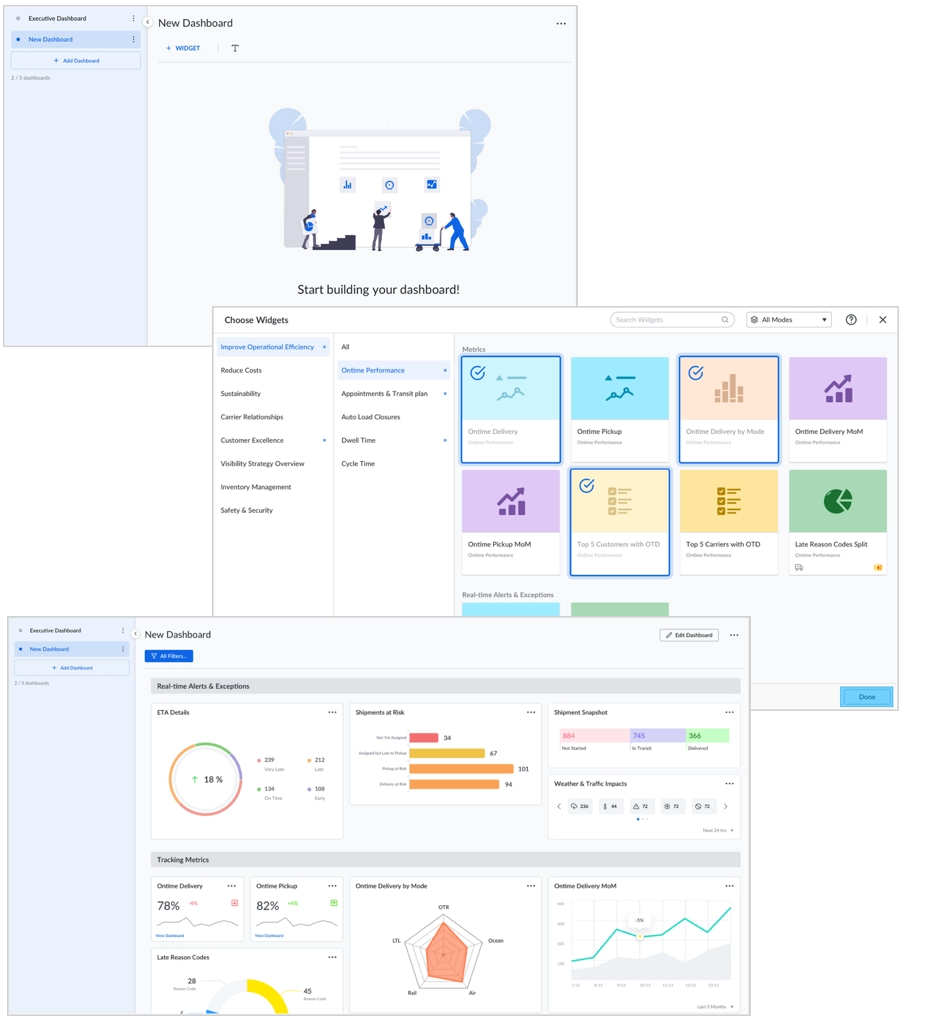

Customizable Executive Dashboard
Users are empowered to customize their dashboards with all the necessary widgets in any desired way. Users will be able to create multiple dashboards and name them accordingly - this option comes in handy when you want to see only certain data in a particular dashboard.
Worked On
Backend Service, Data Aggregation Pipelines, CI/CD Deployment
Tech Stack
MongoDB, Redshift, Elasticsearch, Logstash, Java, React, Kubernetes, Jenkins, Airflow
Date
April, 2020
Challenge
To architect, design and implement data aggregation pipelines for metrics calculations and a microservice for supporting customizations with NoSQL backend store
Solution
Researched through different real-time analytics technologies and created a pipeline with Redshift + ELK. Implemented a Java-based service for enabling dashboard customizations with a schema-less datastore design.

As the user base was more diverse with different types of roles, the metrics that each user would be interested in varied depending on their role in their Logistics org. Instead of showing a single pre-built dashboard for all types of executives, we had to make it more customizable and user-friendly.
Initiating with requirement gathering and identifying the base data sources, I started work on volume analysis and brought in realistic assumptions for the projected scale based on data growth patterns. Tried out POC’s on multiple aggregation technologies like Pinot, Clickhouse, Influx, Timescale, Elasticsearch. After weighing several pros/cons, I went ahead with Elasticsearch + Logstash + Redshift + Airflow for querying the metrics.
The dashboard customizations, being user-created, had to be schema-less. We went ahead with a self-managed MongoDB as the backend data store and a Java + Spring service over the top, which enabled us to seamlessly scale the customizations per user. This service established a contract with the frontend widgets built using React.
